
This overview of search advertising statistics and trends saves marketers from having to find the correct keywords to get the industry information they need. With this view into search advertising, marketers can take the time saved to tweak their search campaigns instead.
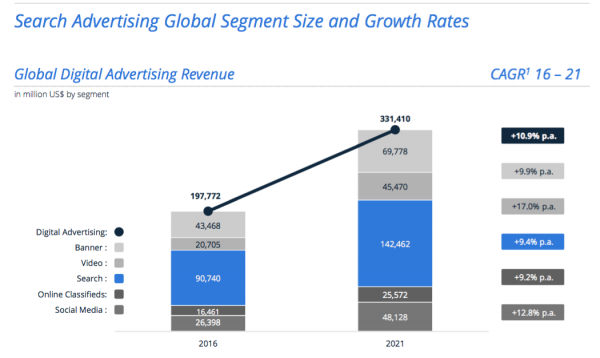
Search Advertising, at an average annual growth rate of 9.4%, is expected to reach a total market size of US$142.5 billion in 2021.
![Which Digital Trends Drive Success for CMOs in 2017? [Free eBook PDF]](https://no-cache.hubspot.com/cta/default/281355/c9e253c9-6173-4927-a77a-730ad29492c3.png)
Search advertising (SEA), also known as paid-search advertising, refers to advertisements marketers target to search result pages based on the keywords search index users type. These ads are typically text and positioned above or next to organic search results. They usually appear as sponsored links or sponsored results. The aim is to reach the right user at the right time by targeting keywords, location, website type, audience interest or user behavior (via remarketing).
With a 46% share, search is the biggest component of the digital advertising market.
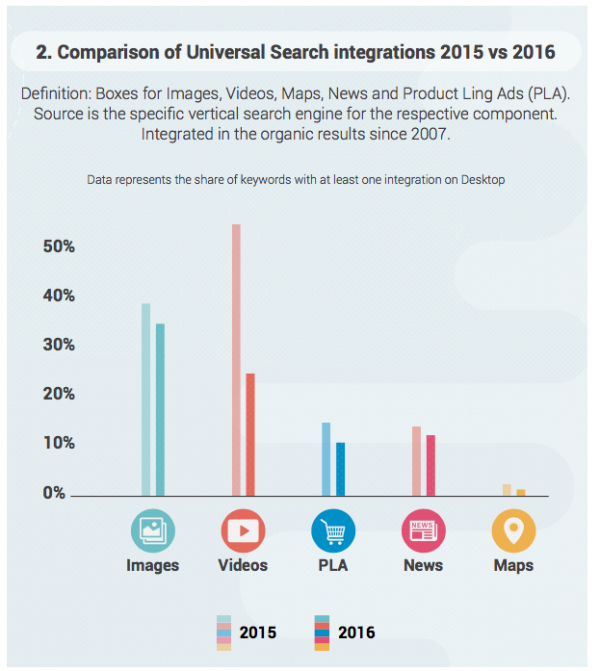 Source: SearchMetrics, via searchengineland
Google Adwords remains the dominant product in SEA. Google reported approximately 3.5 billion searches daily in 2015, and a 13% YoY growth in ad revenue in 2015. Total global advertising revenue for Google was US $67.39 billion.
In November 2015, Google’s Desktop market share was 64%, compared with 21% for Microsoft and 12.5% for Yahoo.
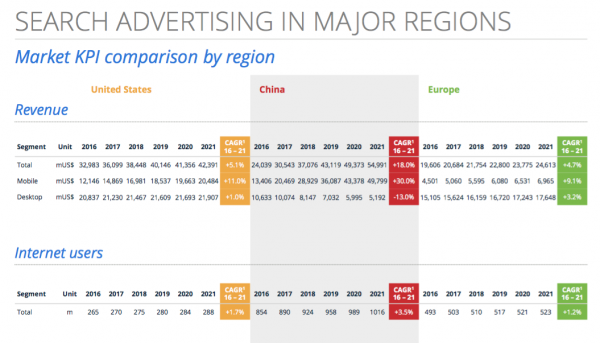
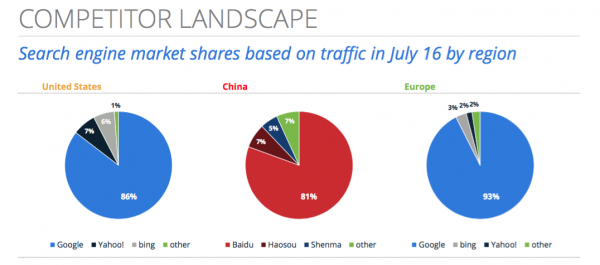
Google’s 85% penetration of US the internet search market is a far cry from its 2.4% share in China. Baidu is the mostly widely used Chinese search engine at 81%. Yet Google retains dominance in Europe despite some regionally relevant competitors in Russia or Czech Republic.
What will be interesting to see is how these statistics and trends shift as Google moves to a mobile index model. Although desktop will remain, priorities are shifting; the top search indexer is adapting too. How marketers will transform their efforts remains to be seen.
Search Advertising Statistics Sources
Buss, S. (2016, July). Search Advertising Outlook. https://www.statista.com/outlook/219/109/search-advertising/united-states#
IAB. (2016, April 14). Digital adspend grows at fastest rate for seven years. https://www.iabuk.net/about/press/archive/digital-adspend-grows-at-fastest-rate-for-seven-years
Martinez, P. (2016, July 26). 17 useful search marketing stats from Merkle’s Q2 2016 report. https://searchenginewatch.com/2016/07/26/17-useful-search-marketing-stats-from-merkles-q2-2016-report/
McEvoy, M. (2016, January 27). 150 Digital Marketing and SEO Statistics to Know in 2016. https://www.webpresencesolutions.net/150-digital-marketing-seo-statistics-2016/
Schwartz, B. (2016, October 6). Report: Number of Google organic blue links results drops from 10 to 8.5. https://searchengineland.com/report-number-google-organic-blue-links-results-drop-10-8-5-260599
Sterling, G. (2016, August 31). Billions served: PC search is down but query volume is way up for Google. https://searchengineland.com/billions-served-pc-search-query-volume-way-google-257899
B2B Marketing and Growth Agency.
Grow your B2B business boldly. Ironpaper is a B2B marketing agency. We build growth engines for marketing and sales success. We drive demand generation campaigns, ABM programs, B2B content, sales enablement, qualified leads, and B2B marketing efforts.

