B2B Articles - Oct 19, 2011 10:56:43 PM - By Ironpaper
One of the great benefits of web-based marketing and advertising is a business or organization's ability to understand the ad's performance or measure ROI. Even small businesses can utilize web analytics to gain tremendous insights into their audience and their online presence.

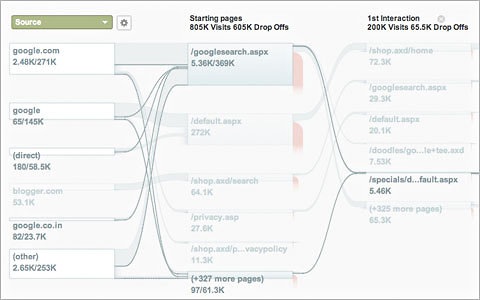
Google is seeking to help push analytics to new heights. A new system called “Flow Visualization” can track the path users take when navigating through website. The flow visualization features will come bundled into Google Analytics, a free analytics tool. The new features will help website owners and web designers better understand how people interact with their properties online. The new tools will help designers see in a graphical way what visitors do on the site.
Such capabilities will allow marketers and designer to use such insights to improve usability, optimize content and navigation and improve all calls-to-action. The features will also allow for easily "seeing" how visitor segments perform on the website--or which segments have a higher abandonment rate using a graphic flow illustration. The interactive map components will help designers make better decisions as they study the data from a new vantage point, as well as communicate their perceptions to clients and project stake holders.