


Even before the great earbud controversy of 2016, Apple was facing steep competition for global mobile market share. This article’s collection of iOS mobile market stats are telling about the 1 billion active mobile users of Apple.
Apple’s share of the global smartphone OS market has been consistently declining since fourth quarter 2011, per IDC. From a peak of 23% at the start of 2012, shipments of the Apple iOS have dropped to 11.8% in second quarter 2016.
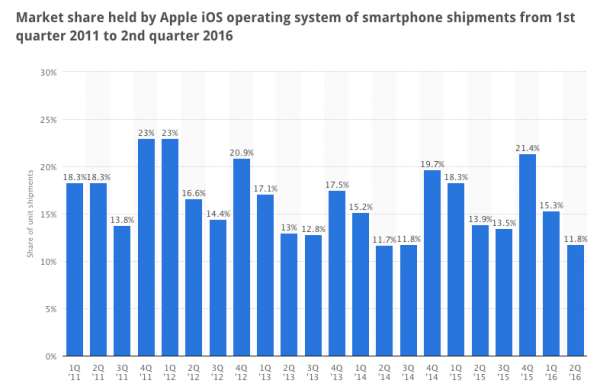 Image source: IDC
Globally, shipments for smartphones are “slowing dramatically,” according to KPCB analyst Mary Meeker. After five years of growth, instead of a 28% year-over-year growth, in 2016, KPCB forecast 10% growth. At the same time, the number of global smartphone users was predicted to grow at 21%, down from the 31% year-over-year previously.
Yet Apple in January 2016 still ranked as the top smartphone manufacturer in the U.S, with 43.6 of market share, per comScore.
Specifically, Apple sold 74.78 million iPhones in Q1 2016, by far the largest contributor to its $18.4 billion in profit on sales of $75.9 billion.
The most popular category of app among Apple iOS users are utilities (99.91%), social networking (95.02%) and photo and video (80.04%) apps. According to research by Shared2you, games, entertainment and lifestyle apps followed next at 78.84%, 78.39% and 76.74% respectively.
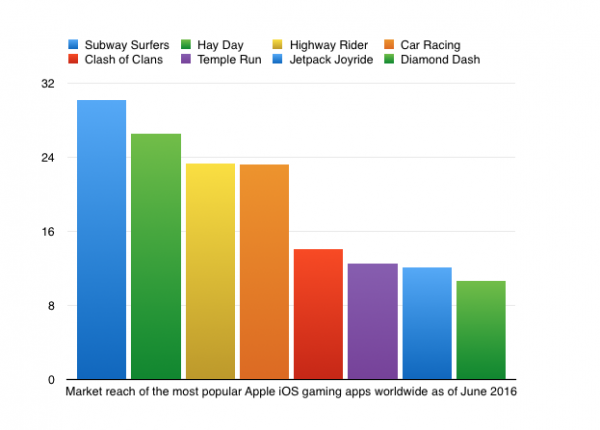
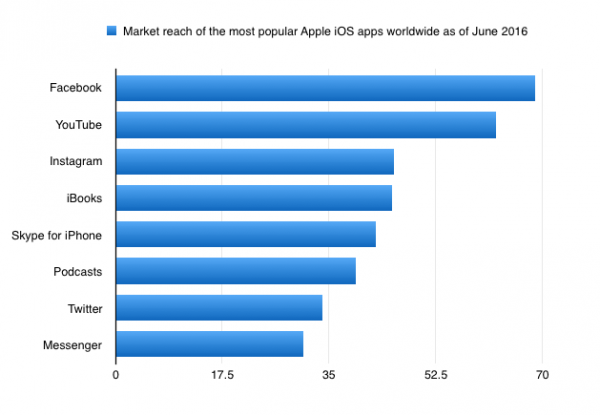
Shared2you also identified the most popular game downloads on iOS as well as the most popular overall apps worldwide.
Further, most active mobile iOS device users worldwide are accessing the Apple iOS on medium-sized phones between 3.5 and 4.9 inches as of March 2015. Full-size tablets, 8.5 inches or larger, were the device of choice for 20 percent of active iOS users, per Flurry.
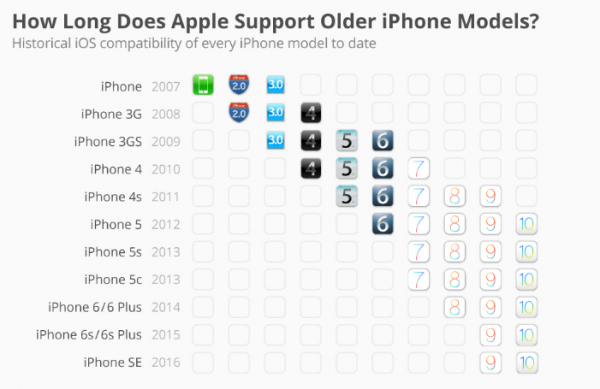
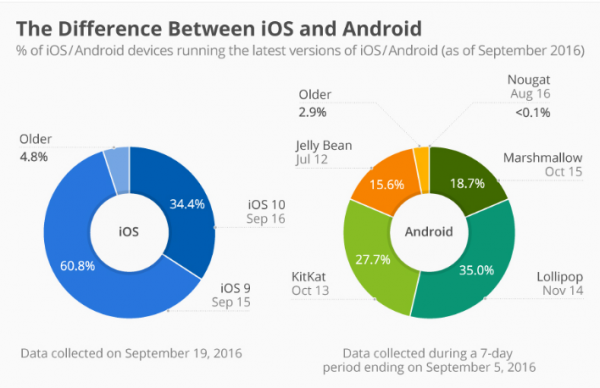
That means millions of Apple users are upgrading their mobile operating system to the September release iOS 10. Or, worse, learning that Apple has left them behind as iPhone 4s and second and third iPad generations can no longer keep up with the demands of the iOS software.
Nevertheless, among those who could update, nearly a third had upgraded within a week of the iOS launch. This was a vast difference from the less than 0.1 percent of Android users running that brand’s Nougat operating system a month after its launch.
At the same time, KPCB’s Meeker predicted Android smartphones would continue to gain market share compared to iOS. With the iOS seeing an 11% year-over-year drop in share while Android saw a 7% increase (already having 81% of the market globally, compared to the iOS’s 16%).
Overall, among Apple’s operating segments, the Americas remain the highest earning with $29.3 billion of its revenue coming from there. Greater China revenue in Q1 2016 came in at $18.3 billion followed closely by Europe’s $17.9 billion.
iOS mobile market stats Sources:
Apple. (2016). Apple Inc. Q1 2016 Unaudited summary data. https://www.apple.com/pr/pdf/q1fy16datasum.pdf
ComScore. (2016, March 4). comScore Reports January 2016 U.S. Smartphone Subscriber Market Share. https://www.comscore.com/Insights/Rankings/comScore-Reports-January-2016-US-Smartphone-Subscriber-Market-Share
Flurry. (2015, April). Distribution of active users on mobile devices (smartphones, phablets, and tablets) using Apple's iOS worldwide, as of March 2015, by form factor. https://www.statista.com/statistics/508400/worldwide-apple-ios-mobile-devices-active-users-by-form-factor/
Meeker, M. (2016). Internet Trends Report. https://www.kpcb.com/internet-trends
Richter, F. (2016, Sept. 13). How Long Does Apple Support Older iPhone Models? https://www.statista.com/chart/5824/ios-iphone-compatibility/
Richter, F. (2016, Sept. 20). The Difference Between iOS and Android. https://www.statista.com/chart/5930/adoption-of-ios-and-android-versions/
Shared2You. (2016, July). Leading iOS app categories worldwide 2016. https://www.statista.com/statistics/270186/global-ios-app-categories/
by Jonathan Franchell, CEO of Ironpaper - For more tips and hacks: Need to remove a new line after h1 tags? Both web designers and SEO practitioners need to employ headline tags: H1, H2, H3 in several ways to improve web page structure and tag...

The Crowded Arena of the IT Marketplace Updated December 2024 The Information Technology (IT) landscape is experiencing rapid growth and intensifying competition. IT spending is projected to reach nearly 5.1 trillion U.S. dollars in 2024, a...
by Jonathan Franchell, CEO of Ironpaper - For more tips and hacks: For iOS app developers, there are some annoying parts of the development process that many developers just hate. For one, only one person can be nominated to be Team Agent on Apple's...
Marketing healthcare technology presents unique challenges that differ significantly from other industries. The complexity of medical products, the stringent regulatory environment, and the diverse needs of healthcare providers create barriers that...