


Our clients came to us because they wish to accelerate growth. One of the key components for growth acceleration is gaining deeper visibility into marketing and sales performance. For this reason, we started using near real-time dashboards and analytics to provide a more clear window into marketing performance.
We are excited to open up some of the dashboard templates that we use for our clients to the public. To that end, we are introducing our "Monthly Lead Generation Dashboard," a databoard that is available within the Databox Template Gallery.
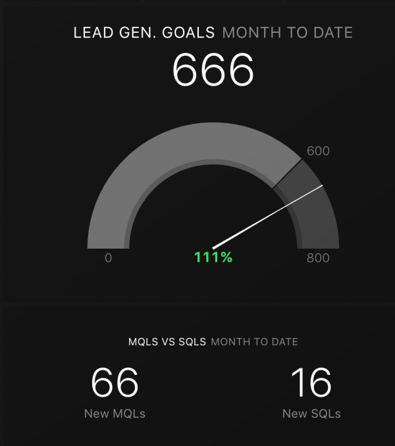
A Databox databoard template
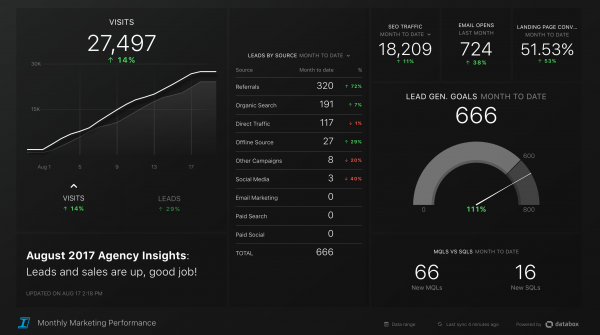

For B2B companies that wish to accelerate lead generation efforts, we created an essential tracker of key metrics that cut through the clutter of marketing idiosyncrasies. This databoard provides a near-real-time view of B2B lead generation performance on a monthly basis.
The purpose of this databoard is to provide a high-level, month-to-date performance snapshot of B2B lead generation efforts and outcomes. The databoard was designed for sharing key lead generation performance with executive teams, stakeholders, and marketing leadership.
The dashboard provides a streamlined view of monthly lead generation performance using data from HubSpot's Marketing product.
This template provides a birds-eye view of B2B lead generation performance. Essentially, it's a snapshot of month-to-date key metrics: leads, MQLs, and SQLs acquired. Timespan toggling is enabled for each datablock in order to compare current performance to past performance. The template also highlights some key performance indicators, such as visits, landing pages, SEO overview, and emails viewed.
This databoard template uses HubSpot Marketing exclusively. We wanted to keep the integrations for this monthly snapshot simple and easy to get up and running.

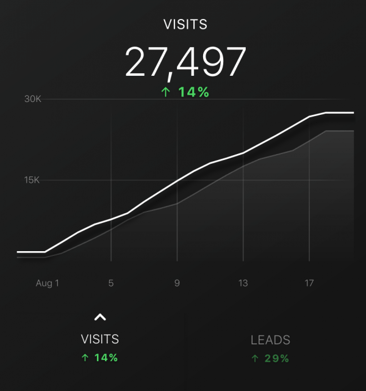
1.) The first section (data block) showcases overall traffic and leads acquired month-to-date using a clearly readable line chart. You can easily toggle between visits and leads to display the monthly cumulative graph for each.
2.) The next data block section is an editable text area that allows the marketing team to share notes with any stakeholders that review the shareable report. The text area can support a short, concise statement, a few sentences, or a link to a corresponding resource.

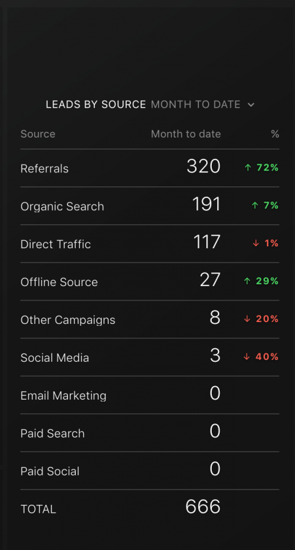
3.) The next data block section provides a source report for lead generation. This section contains three toggle views (month-to-date, last month, and quarter-to-date). In HubSpot, the Source Report focuses primarily on contacts generated, which we feel is a pretty big limitation.
So, for our databoard template, we refocused this source report to spotlight the marketing channels that drive leads. For each channel, there is a percentage gain or loss (green or red) to quickly spot improvements or areas of need.
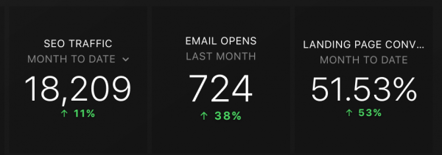
4.) The next section contains three small marketing performance indicators common to many B2B lead generation efforts. The three performance indicators focus on:
Each unit provides a drop-down option for reviewing month-to-date vs previous month performance.
5.) The final section is really a grouping of three data blocks that serve a similar purpose--to highlight leads, MQLs, and SQL acquisition numbers month-to-date. This performance snapshot allows for a quick read on the critical monthly numbers. This section acts a marketing pipeline overview and will be a great vehicle for communicating marketing performance to executive teams and stakeholders.
We plan on releasing more Databox templates soon. Feel free to contact us for help with customizing your databoard or building custom near-real-time dashboards for tracking marketing and sales performance. Ironpaper is a certified Databox partner.
by Jonathan Franchell, CEO of Ironpaper - For more tips and hacks: Need to remove a new line after h1 tags? Both web designers and SEO practitioners need to employ headline tags: H1, H2, H3 in several ways to improve web page structure and tag...

by Jonathan Franchell, CEO of Ironpaper - For more tips and hacks: For iOS app developers, there are some annoying parts of the development process that many developers just hate. For one, only one person can be nominated to be Team Agent on Apple's...
The Crowded Arena of the IT Marketplace Updated December 2024 The Information Technology (IT) landscape is experiencing rapid growth and intensifying competition. IT spending is projected to reach nearly 5.1 trillion U.S. dollars in 2024, a...
Marketing healthcare technology presents unique challenges that differ significantly from other industries. The complexity of medical products, the stringent regulatory environment, and the diverse needs of healthcare providers create barriers that...